The Urgency for a Common Air Quality Indicator in South-East Asia
As Singapore is set to host talks from June 7 to 8 with Asean members Brunei, Indonesia, Malaysia and Thailand, environmental experts are planning a second roadmap focussing on strategies towards attaining a haze-free South-east Asia.
This comes at a critical time, given the expected drier weather conditions and the potential onset of the warmer El Nino weather phenomenon in the coming months.
Associate Professor Helena Varkkey from the Department of International and Strategic Studies at Universiti Malaya, believes that creating a common air quality index is a significant step forward. This will allow for a uniform measure of air quality across the region, eliminating discrepancies and confusion resulting from various countries using different indices.
Currently, different nations in the region use unique air quality index systems. Singapore uses the Pollutant Standards Index (PSI), Malaysia uses the Air Pollution Index (API), and Thailand uses the Air Quality Index (AQI). These variations make it challenging to compare air quality data effectively across the region.
The proposed second roadmap for transboundary haze cooperation aims to address this issue and further emphasises the need for coordinated efforts and measurable indicators of progress.
At AirScape.ai, we understand the critical need for real-time, street-level air quality data for truly actionable insights. We stand in solidarity with these efforts to standardise the method of tracking air quality across South-East Asia. It’s essential for the implementation of effective measures and policies to mitigate air pollution and promote a healthier living environment for all inhabitants of the region.
Our latest initiative in collaboration with ITDC (Indonesia Tourism Development Corporation) recently launched an air quality monitoring system in Nusa Dua, a popular tourist destination in Bali. This Corporate Social Responsibility (CSR) project aims to provide high-quality air monitoring and improve air quality in one of Indonesia’s most visited tourist destinations.
The system is equipped to provide real-time data on air quality to both tourists and local residents, empowering them to make informed decisions about their activities and daily routines. We are committed to supporting sustainable tourism in Bali, and the launch of this monitoring system is a significant step towards this goal. By providing detailed air quality data, we hope to help the tourism industry in Bali make more sustainable and responsible decisions that prioritise the health and wellbeing of visitors and the environment.
As this article in The Straits Times highlights, “The road map will guide Asean member states in making demonstrable improvements to achieve our vision of a haze-free South East Asia.” We strive to be part of the solution in achieving this vision.
Remember, actionable data is the key to making meaningful changes.
Stay informed, stay healthy.
AirScape has been implemented at Crema Comprehensive School Two in Crema, marking the first time our cutting-edge technology has been deployed in Italy.
This exciting development was celebrated with an event at the school, featuring a performance by local musician Davide Milani, an inspiring speech by the school’s headmaster, Pietro Valsecchi, and a comprehensive presentation led by AirScape’s Country Manager, Andrea De Vizio.
Our innovative solution empowers communities with real-time, street-by-street monitoring of environmental pollutants, marking a significant advancement in the fight against air pollution. By introducing this technology to schools, we are nurturing environmental consciousness right at the heart of our communities. Schools play a vital role in educating the next generation about the importance of sustainability and promoting a culture of environmental stewardship.
We were thrilled to have the support of the Crema Comprehensive School Two in this venture. This endorsement signifies a shared commitment to the wellbeing of our children and the health of our planet. Through real-time air quality data, we aim to ensure a healthier environment for Crema’s children and, ultimately, for everyone.
The successful deployment of our devices at the primary school in Crema marks the beginning of a broader initiative. Our goal is to extend this project beyond schools to cover entire communities and urban areas across all Italian cities. The first installation in Crema is only the beginning, with negotiations currently underway for additional locations.
This step forward in Crema holds significant importance, not only for AirScape but also for the awareness of air quality and health. Air pollution is a critical issue that warrants attention, discussion, and action now more than ever. By harnessing the power of our technology, authorities can better understand and manage air quality, using our actionable data for sustainable decision-making in the future.
We are in active communication with local authorities and regional bodies to explore potential funding opportunities and establish a monitoring role across the region. We aim to leverage our innovative solution for wider application, contributing to a more sustainable future for all.
We are excited to share the progress we are making. Join us as we embark on this important journey towards sustainability, improving air quality, and safeguarding the wellbeing of our children and our communities. Together, we can make a difference. Stay tuned for more updates on our efforts in Italy and beyond.
On April 22nd, the world celebrates Earth Day, a day dedicated to raising awareness about environmental issues such as climate change, air pollution, and deforestation. At AirScape, we believe that clean air is a fundamental human right, and we are committed to helping communities around the world reduce air pollution exposure.
As Earth Day approaches, it’s a timely reminder of the need to take action and make a positive impact on our planet. This year’s Earth Day theme is “Invest in Our Planet,” focusing on the urgent need for governments, businesses and individuals to invest in a better future for the planet.
Air pollution is a significant contributor to climate change and has a devastating impact on the health of people and the planet. The World Health Organization (WHO) estimates that 9 out of 10 people breathe polluted air, which leads to around 7 million deaths per year globally. The impact of air pollution on our health cannot be overstated, and it affects people of all ages, backgrounds, and income levels.
That’s why we are dedicated to providing the most detailed air quality data to communities and decision-makers around the world. Our mission is to inform the everyday quality of life decisions and improve health and wellbeing in urban spaces across the world. Through a collaboration of public and private enterprise, we aim to make a meaningful impact on the fight against air pollution.
Cities that adopt the AirScape solution are at the forefront of addressing the genuine concerns of their citizens and actively working towards resolving them.
We are thrilled to announce our latest initiative in collaboration with ITDC (Indonesia Tourism Development Corporation): the launch of an air quality monitoring system in Nusa Dua, a popular tourist destination in Bali. This Corporate Social Responsibility (CSR) project aims to provide high-quality air monitoring and improve air quality in one of Indonesia’s most visited tourist destinations.

The system is equipped to provide real-time data on air quality to both tourists and local residents, empowering them to make informed decisions about their activities and daily routines. We are committed to supporting sustainable tourism in Bali, and the launch of this monitoring system is a significant step towards this goal. By providing detailed air quality data, we hope to help the tourism industry in Bali make more sustainable and responsible decisions that prioritize the health and wellbeing of visitors and the environment.
But our work isn’t limited to Bali, as we establish and enhance air quality monitoring networks worldwide in support of sustainability projects. Some of our noteworthy installations include the world’s densest air quality data network in the London Borough of Camden; a system for assessing the impact of the Port of Dublin on the city’s air quality; an innovative monitoring solution at the Green Building Site in Denmark, which empowers the construction industry with valuable insights into the most effective green initiatives for maximising climate and environmental benefits; and a project focused on measuring air quality around school buildings in Crema, located near Milan in Italy.
At AirScape, we know that you can’t manage what you can’t measure. That’s why our technology provides the most detailed and accurate air quality data available. We believe that by providing this data to communities and decision-makers, we can make a meaningful impact on the fight against air pollution.
On this Earth Day, we encourage everyone to take action to protect our planet. Whether it’s reducing your carbon footprint, supporting sustainable initiatives, or simply spreading awareness about air quality and environmental issues, every action counts.
At AirScape, we remain committed to our mission of providing detailed air quality data to communities around the world, and we urge everyone to join us in the fight for a cleaner, healthier planet.
Our monthly report for March 2023 focuses on analysing the pollution patterns over the sensor network in Camden, London. We examined a representative sample of 80 nodes, which is one-third of the whole network, and looked at hourly averages of PM2.5, O3, and NO2. In this report, we present our findings and compare pollutant concentrations to previous months.
Our report indicates a stable daily pattern for NO2 pollutant formation, and we found that its concentration in March was higher than the WHO guidelines for 24-hour NO2 average. Additionally, we observed a significant increase in O3 concentration in March compared to previous months, particularly in the second half of the month.
We also identified a hotspot of PM pollution and provided a possible explanation for it. You can find a clue in the picture!
Although AQI levels in March were still high, we are glad to report that they have slightly decreased compared to January and February.
London did not declare a high pollution alert in February despite the fact that, in Camden, the air quality was worse than in January.
Our report on the air pollution trends in Camden, London in February 2023 analysed data from a representative sample of AirNodes from the AirScape sensor network in Camden which measures street-level air quality data in real time. It showed an increase in all major pollutants in February compared to January.
| Month/Pollutant | NO2 in ug/m3 | O3 in ug/m3 | PM2.5 in ug/m3 |
| December | 36.6 | 25.7 | 11.6 |
| January | 40.5 | 29.9 | 8.6 |
| February | 41.3 | 30.5 | 10.3 |
The PM2.5 data showed some increased concentration strongly above the average for at least 10 days in February. The periods between the 6th and 9th as well as 13th to 16th were especially bad. The average concentration in the 13th-16th period (31.6 ug/m3) increased three times compared to the average February concentration (10.3 ug/m3). The pollution was of a similar scale that caused the London authorities to raise a high pollution alert on 24th January (18.5 ug/m3) and 25th January (29.5 ug/m3).
The AQI levels reached unhealthy thresholds again, and air quality was very poor on the 14th of February. You could argue that from a health perspective staying home on Valentine’s Day was probably a better decision this year than going on a romantic walk.
The data also revealed two periods of elevated NO2 concentrations on the 6th-10th and 13th-16th of February, with NO2 concentration being clearly higher than the WHO guidelines for 24-hour NO2 average (25 ug/m3).
The ozone concentration showed much higher variability in February compared to NO2. The average concentration of O3 in the last three months (from December to February) remained at similar levels and slightly increased month over month, probably due to increasing sunshine duration. However, periods of low wind speed from the east contributed the most to the low ozone concentration in February. Strong winds from the north that should have reduced the ozone concentration in the city didn’t help in the last days of February due to strong solar radiation. The correlation between wind speed and direction with ozone is very noticeable.
The pollution seems to be correlated with lower temperatures and small wind speeds. Higher wind speed, precipitation, and warm weather have a significant positive impact on lowering PM concentration.
Prof Matthew Johnson, Chief Science Officer at AirScape said “Air pollution is one of the most profound issues facing humanity today. Clean air is a human right, just like clean water and safe food.
We saw that pollution in the city was of a similar scale which caused the London authorities to raise a high pollution alert in January. This, however, didn’t happen in February even though the AQI levels reach unhealthy thresholds again.”
Jorge M Vasquez, Chief Executive Officer at AirScape said “The significance of everyone being aware of the air they breathe cannot be overstated, as demonstrated by this report. Cities that adopt the AirScape solution are at the forefront of addressing the genuine concerns of their citizens and actively working towards resolving them.”
World Health Organization (WHO) data shows that almost all of the global population (99%) breathe air that exceeds WHO guideline limits and contains high levels of pollutants, with low- and middle-income countries suffering from the highest exposures.
With at least 40,000 premature deaths each year in the UK due to air pollution, toxic air is a known contributor to cancer, heart disease, strokes and asthma. Causing over 20x more deaths than road traffic accidents[i], poor air quality costs society, businesses and our NHS services more than £15 billion a year. To reflect the increasing scientific evidence of the harm to health caused by toxic air, the WHO sharply reduced its guideline limits for air pollution last year.
AirScape, in partnership with Camden Council and The Camden Clean Air Initiative, installed 229 AirNode air quality sensors across the borough of Camden in London to capture hyper-local air quality data every minute, to map the problem in real time. The ground-breaking network provides 45 times more spatial resolution and refreshes 60 times more regularly than existing air quality reference stations. They aim to replicate the model across London and major cities worldwide to enable real action on air pollution.
Data is freely available on the AirScape web platform, at airscape.ai, to enable individuals, businesses and local authorities to make quality-of-life decisions that improve air quality for all. The data generated from the network can be used in a myriad of ways, enabling the public to choose less polluted routes from A-to-B, feeding into local traffic management policy and providing NHS Trusts and schools with information to help raise awareness of air pollution and protect vulnerable communities. The future possibilities of how the data can be used are vast and AirScape is aiming to engage with potential partners, clean air groups and councils to explore future collaboration.
This report serves as a reminder that air pollution is still a major problem, and we need to take measures to address it. The report provides scientifically advanced air quality information that is easily accessible to the public. The findings will be used to improve air quality in Camden, London, and other cities around the world.
Based on the data gathered by the Camden Network in London, February was another eventful month regarding air pollution. Of greater concern is that London did not declare a high pollution alert in February, despite the air quality being worse than it was in January.
NO2 data exhibited stable daily patterns, with of slight increase in all pollutants compared to January. The concentration of NO2 was higher than WHO guidelines throughout January.
Ozone is slightly increasing each moth due to increased sunshine duration.
We saw increased PM2.5 concentration strongly above the average for at least 10 days in February. The highest PM concentration, three times higher than average for the month, were between 6-9th February and 13-16th.
Pollution levels of a similar scale that prompted a high pollution alert by London authorities on 24th January was seen again in February – but without another alert. Live data from airscape.ai showed in real time the increased pollution over the Camden borough and could have a real impact on those more vulnerable to air pollution (Fig. 7 and 8). Figure 7 shows that Valentines Day was not the best time for a romantic walk.
Read February’s full report here
Based on the data gathered by the Camden Network in London, January was another eventful month regarding air pollution.
NO2 data exhibited stable daily patterns, with of higher concentrations coinciding with cold air and low wind speed in the 2nd half of the month. The concentration of NO2 was higher than WHO guidelines throughout January.
Changes in wind direction and intensity from continental Europe saw Ozone levels showing much higher variability.
PM showed some moderation in January compared to December. The highest PM concentration was observed between 21st and 26th of January corresponding to the low temperatures in that period.
High pollution in January was also noticed by London authorities. A “high pollution alert” was issued on 24th January following the forecast from Imperial College London. The alert correctly predicted pollution events for the next few days. However, it was late to caution citizens against increased pollution during the weekend (21st and 22nd January). Live data from airscape.ai showed in real time the increased pollution over the Camden borough and could have a real impact on those more vulnerable to air pollution. Figure 7 clearly shows that high PM concentrations were observed already on 22nd of January. This also corresponds well with NO2 data from the same period.
Read the full report here
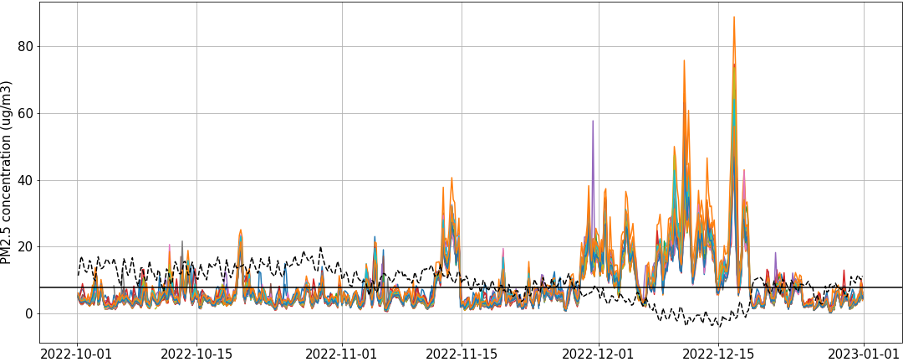
Fig. 1: PM2.5 4-hour average in October- December period. The black horizontal line represents an average of AirNodes for December. The black dashed line represents temperature observed in the AirNode.the
AirScapes PM2.5 data shows a great increase (over 200%) in PM concentration in December compared to earlier months (Fig.1). The increase in PM concentration is more visible in the 1st half of December (Fig. 2), especially between 8th and 17th of December when average temperature oscillated around 0oC.
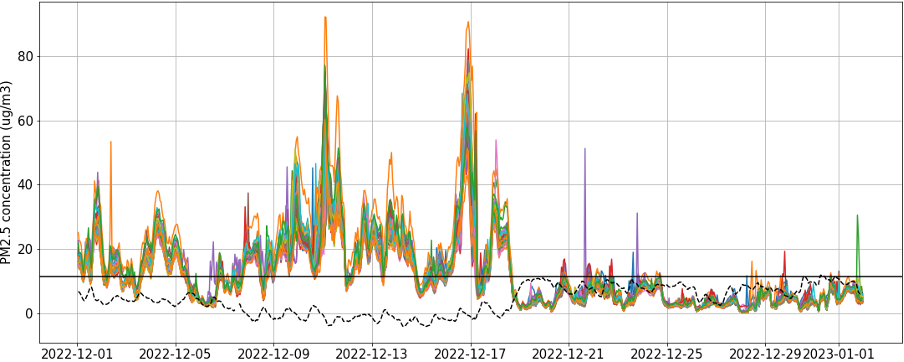
Fig. 2: PM2.5 hourly average in December. The black horizontal line represents an average of AirNodes for December. The black dashed line represents temperature observed in the AirNode
The PM2.5 pollution in that period was on average four times higher than the average pollution of the last two months (October and November).
The increase can be probably attributed to an increase in wood burners usage or other ways of increasing temperature in residential areas. The high concentration of PM can be further explained with low precipitation and low wind speed during that period, which would enhance the polluting effect of local sources.
Contrary to the 1st half of December, the 2nd half saw a decrease in PM concentration. This might be an outcome of a combination of both higher temperatures (lesser usage of wood burners) and increased rainfall and wind speed.
Read the full analysis here
AirScape would like to wish everyone Happy Holidays as 2022 draws to a close. 2022 has been an incredible journey for our company, with data coming in from installations at the Port of Dublin, Port of Aarhus, Staffordshire, and the crown jewel, AirScape’s installation of the world’s largest dense network of air pollution monitoring sensors in the Borough of Camden in London. We would like to present some of the highlights of this year.
During the first quarter of 2022 we were commissioning the system and the first data started to come in. At the end of February we saw a massive shift in carbon dioxide levels across the borough. Very quickly we could eliminate many potential causes such as data quality and local emission. Finally we used a global model of atmospheric meteorology from the National Oceanographic and Atmospheric Administration (NOAA) in the USA to determine the source, a subglacial volcano on Iceland called Katla that turns out to be the largest natural source of CO2 in the northern hemisphere. This plume of CO2 took about half a week to cross the North Atlantic before descending on Camden.

Throughout the year the monitoring network has seen many details of day to day life. Rail strikes in early March meant increased traffic as Londoners used vehicles to go about their business. The network recorded 3 % increase in CO2, 66 % in NO2 and 316 % in PM. During the August rail strike we saw the opposite — many people simply stayed home, and air pollution dropped.
There was a fire on a roof at Chalk Hill Farm in June. We were recording an interview with the BBC at the Camden Locks and the cameraman saw a plume of thick black smoke through the camera. Our sensors were able to record the event, showing when and where it occurred and how quickly it could be extinguished. In addition to air pollution, we hope that monitors such as ours will also contribute to increased public safety in episodes like this.
The largest story of the year in our opinion, is that Camden continues to struggle with air pollution. We see pollution events every day, both large and small, lasting from minutes to days, that are cause for concern for anyone in Camden. We are very glad for the continued collaboration with Camden Clean Air Initiative because we can work together to increase awareness. We are also extremely grateful for the support we have received from the Camden City Council which ranges from logistical support with mounting the sensors, to their pledge to improve air quality for residents of Camden. This includes the pledge to bring Camden into compliance with the new WHO Air Quality Exposure Guidelines.
Thanks to everyone for your support and we are looking forward to new adventures in 2023.
The UK Chief Medical Officer Annual Report is a clear and convincing call to action.
This year’s report lays out the scale of the challenge of reducing air pollution, the substantial progress that has been made and highlights achievable solutions.
The report identifies many win-win (or win-win-win!) scenarios. For example, increasing active travel like walking and biking will reduce toxic air pollution, decrease greenhouse gas emissions and directly improve health through physical activity.
‘The path to better outdoor air quality is clear, and we need to go down it.’
The report points out that there is still a long way to go. With current policies, by 2030, all of southern and eastern Britain is projected to exceed the WHO annual exposure threshold for PM.
Regarding Urban Planning the report states
‘Urban planning should support reducing air pollution concentrations locally – such as reducing air pollution near schools and healthcare settings. Shifting to active travel where possible has direct health wins as well as reducing air pollution from vehicles planning should support this.’
Street-level air quality data in real time will be essential to measure the impact of these solutions.
Click here to read the report in full.