Low temperatures, low wind and low rain increases PM2.5 fourfold
- By AirScape
- January 17, 2023
Low temperatures, low wind and low rain increases PM2.5 fourfold
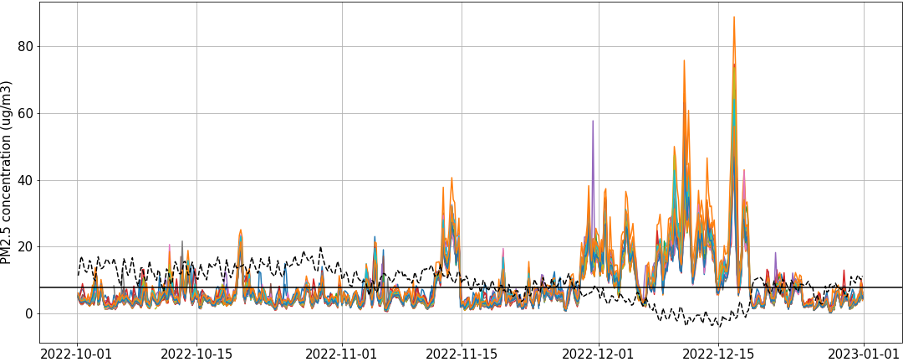
Fig. 1: PM2.5 4-hour average in October- December period. The black horizontal line represents an average of AirNodes for December. The black dashed line represents temperature observed in the AirNode.the
AirScapes PM2.5 data shows a great increase (over 200%) in PM concentration in December compared to earlier months (Fig.1). The increase in PM concentration is more visible in the 1st half of December (Fig. 2), especially between 8th and 17th of December when average temperature oscillated around 0oC.
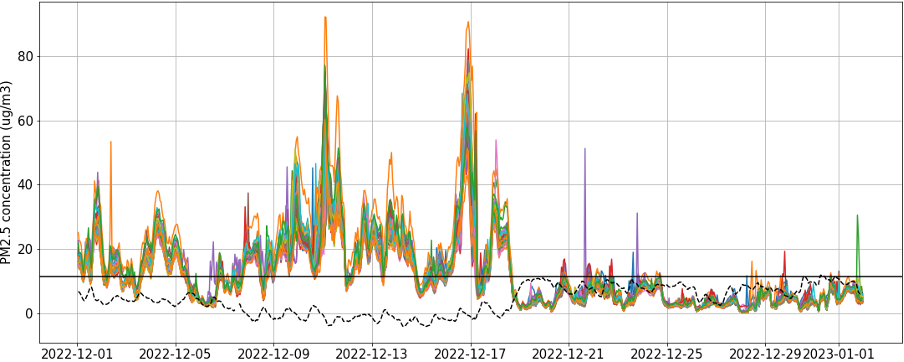
Fig. 2: PM2.5 hourly average in December. The black horizontal line represents an average of AirNodes for December. The black dashed line represents temperature observed in the AirNode
The PM2.5 pollution in that period was on average four times higher than the average pollution of the last two months (October and November).
The increase can be probably attributed to an increase in wood burners usage or other ways of increasing temperature in residential areas. The high concentration of PM can be further explained with low precipitation and low wind speed during that period, which would enhance the polluting effect of local sources.
Contrary to the 1st half of December, the 2nd half saw a decrease in PM concentration. This might be an outcome of a combination of both higher temperatures (lesser usage of wood burners) and increased rainfall and wind speed.
Read the full analysis here